Stats special: The evolution of Rooney-ball
Our start to the season in five key areas
Welcome to another special stats edition of One Team In Devon with super football analyst and statistician Alberto Lauciello.
The last time we did one of these, we took apart Ian Foster’s Argyle – and used the results to show how Argyle had deteriorated in their attacking play.
This time out we’re looking at a different set of data.
The aim of this newsletter is to understand how this Argyle team is evolving under Rooney.
Buy Alberto a Coffee: https://ko-fi.com/lauce44
And due to the time constraints of Alberto and I getting this done around family, work and kids, this has landed closer to the Cardiff game than we’d have liked. But regardless of what happened at Cardiff, the stats are to be looked at in context over the long term. One game deviations need to be looked at in context.
We’ve seen a gradual improvement in the team over the course of the first nine games – but what is driving that?
Let’s dig in.
Improving defending
An early problem for Argyle was conceding big chances – but that is showing signs of steady improvement.
A "big chance" is typically defined as a situation where a player should reasonably be expected to score, often involving 1v1 situations with the goalkeeper or a clear shot on goal from close range.
The above shows a timeline of Argyle's matches including league and cup fixtures (notably, there's an EFL Cup game against Watford on August 27th).
The dashed green trendline shows the overall trend of big chances conceded over time.
After a poor start, where Argyle allowed several big chances in their first few matches, the chart reflects a significant improvement in their defense. Fewer clear goal-scoring opportunities are conceded, implying better defensive organization and structure under Rooney.
The spike in big chances conceded against West Brom (September 21st) seems to be an outlier in an otherwise positive trend.
But we need to look at this in context – because defensively Argyle are still not amongst the strongest in the division.
Improving defence – but within context
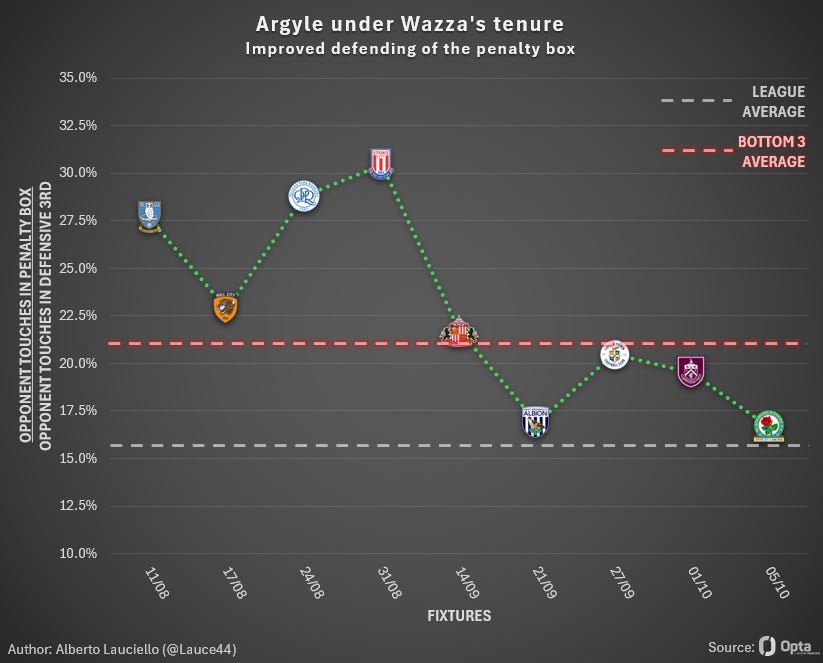
To stop the opposition from creating big chances, you need to stop them from entering the penalty area and getting into the “red zone” where most goals are scored.
The above chart tracks the ratio of opponent touches in the penalty box as a percentage of total opponent touches in the defensive third.
As you can see, Argyle’s early season performances allowed opponents into the box at a far higher rate. And worryingly, to an extent hauntingly similar to that of a relegation team.
After the international break before the Sunderland game, you can see a huge drop in the rate at which Argyle allowed opponents into the box. That marries up with the systemic change that saw an extra man in midfield, progressing away from the 4-4-2 – and that trend has continued.
Argyle are progressing towards the average for the league, which would help solidify a mid-table finish. But you can also see how fragile that can be.
A changing style of play
OK, this one needs some explaining.
The graph above shows that Argyle’s style of play had evolved over the season so far.
In early games, Argyle were a vertical team. That meant that a high percentage of passes were progressive – up the pitch. Over time that has changed, with vertical progressive passes making up fewer and fewer of our passing range.
What does that mean? Low verticality means you’re passing side-to-side, and that is indicative of a possession-based team.
In the early part of the season, Argyle struggled to get attacking players on the ball – possibly because of their verticality. So as they have moved to an increasingly possession-based style, it has enabled them to get players into better positions. It should be noted, however, that we are not (yet) truly a possession-based team.
There are a few factors here: Al Hajj is an obvious one, but so is Grimshaw – and Argyle have played out from the back better with him in the side. That would certainly account for a sudden increase in horizontal passes. That has also enabled Randell to pump in some incredible performances.
As you can see – Argyle are far from becoming a Pep side, and have only moved under the league average for verticality. But it’s a pronounced change.
Argyle’s improved attacking prowess
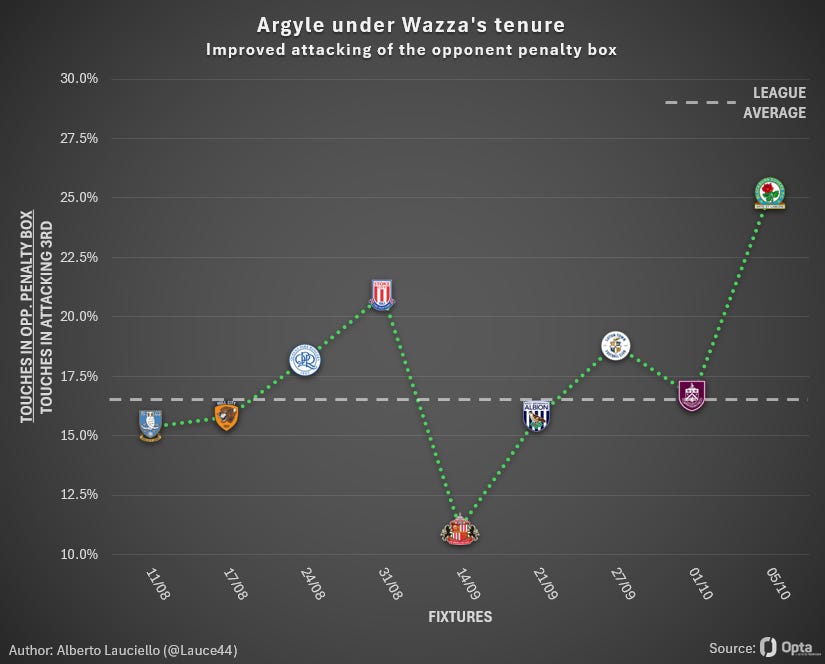
This chart focuses on Argyle's improved attacking of the opponent’s penalty box under Wayne Rooney's management. Here's a breakdown of the key elements.
It’s the same premise as the graph earlier, showing the percentage of our touches in the attacking third occurring within the opponents’ penalty box.
Argyle have always been around the league average for the percentage of touches in the opponent’s box – even if we appeared toothless in the early season games.
It looks to be getting better – slowly. But there are big swings in our attacking performances, even in games we’ve won (Sunderland). And noticeable swings in terms of how much we enter the box.
Set piece woes
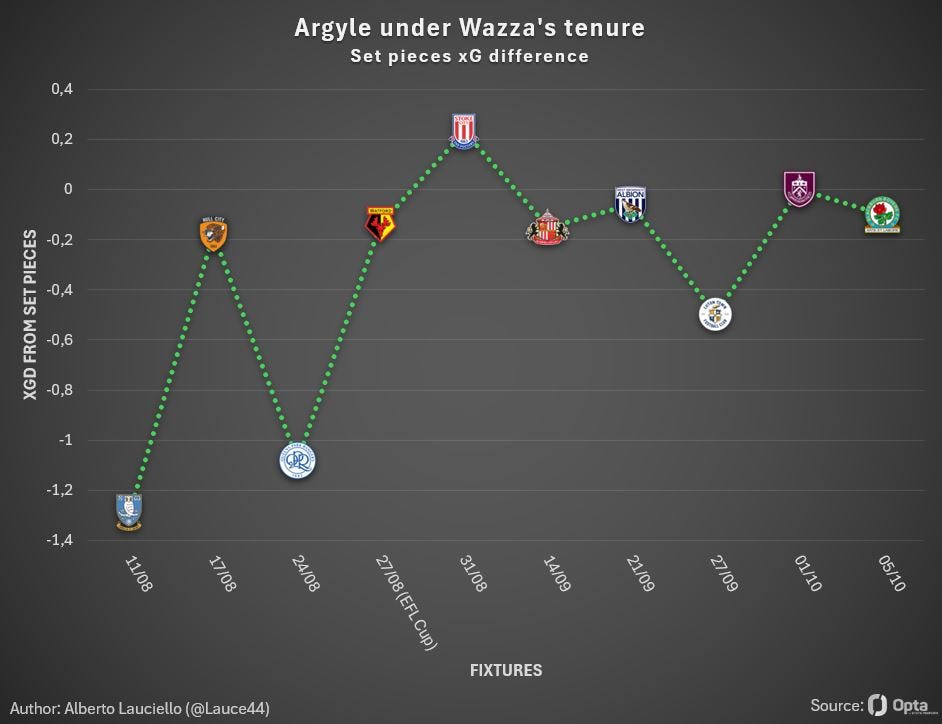
Despite recent improvements, Argyle still face significant challenges when it comes to set-pieces.
Our xG (expected goals) difference from set pieces paints a clear picture: we’ve consistently been outperformed by our opponents both in creating and defending chances from dead-ball situations.
Argyle are:
Last in the League for xG from set pieces, having generated just 0.95 expected goals so far this season.
23rd in shots from set-piece actions, with only 18 shots resulting from these situations.
On the defensive side, we rank 21st for xGA (expected goals against) from set pieces, conceding an alarming 4.14xGA (the 4th worst in the league).
Worse still, we’ve allowed the most shots in the league from conceded set pieces, with opponents taking a staggering 52 shots.
While we’re slowly improving in this area, there’s clearly still a long way to go. Set pieces remain an area of concern, and better organization and execution will be crucial as we push for more consistent performances across the board.


